Akron Community Foundation is audited on an annual basis by Maloney + Novotny LLC. Previous audits were conducted by Sikich.
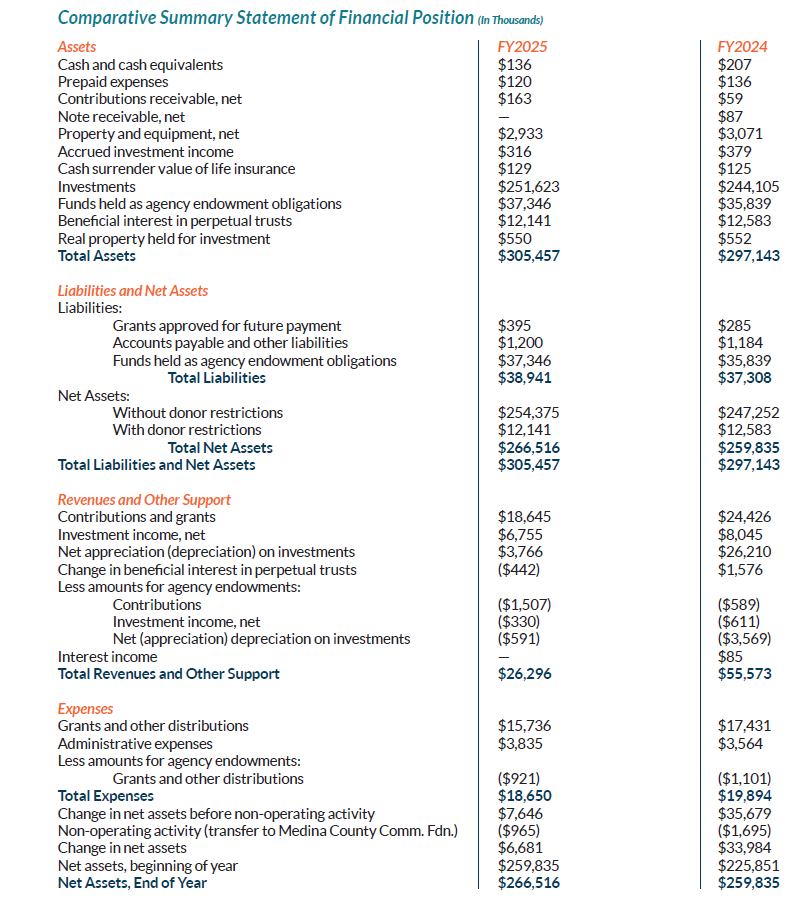
2025 Akron Community Foundation Financial Statements
2024 Akron Community Foundation Financial Statements
2023 Akron Community Foundation Financial Statements
2022 Akron Community Foundation Financial Statements
2021 Akron Community Foundation Financial Statements
2020 Akron Community Foundation Financial Statements
2019 Akron Community Foundation Financial Statements
2018 Akron Community Foundation Financial Statements
2017 Akron Community Foundation Financial Statements
2016 Akron Community Foundation Financial Statements
2015 Akron Community Foundation Financial Statements
2014 Akron Community Foundation Financial Statements